
Lesson 12: Data Collection and Analysis
Learning objectives
After completing this lesson, students will be able to:
- properly save radiosonde and surface data
- make some quick data analysis
- NEW Jan. 2024: detailed tips and tricks for analyzing the Planetary Boundary Layer data
- NEW Jan. 2024: How to quality control NEBP data
Prerequisites
Some basic Excel skills are necessary. For teams that wish to analyze the data in depth, it would be useful to use a programing language such as Python ort R rather than Excel, but experience with these languages is not required.
Data collection and analysis for NEBP
As an atmospheric science team, you will be gathering multiple types of data during your field campaign. This data will also come in multiple formats depending on its source. One set of data that will be collected after the field campaign is complete is the data that is being continuously collected from your Lufft weather station.
This data will be downloaded from the program used to interface with the Lufft throughout the campaign as a .txt file. It holds important information about the impact of the eclipse on the ground weather conditions (temperature, solar irradiance, etc.).
The other sets of data that you save include multiple files from the Grawmet software which is used to receive signals from the radiosondes during flight. The first set of data that you will save from Grawmet is a copy of the SkewT-LogP plot for each flight. This is useful for comparing any post-campaign results to those obtained during the field campaign.
The second set of data is a .txt file which contains all of the data transmitted from the radiosonde to the software during flight. This data is critical for analysis post-campaign. The final file that you will need to save a back-up copy of is a .zip file produced by Grawmet after you terminate the flight. This .zip file can be used after the field campaign is complete to rerun flights, to adjust the initial input values, and to reproduce the results should a .txt file be misplaced.
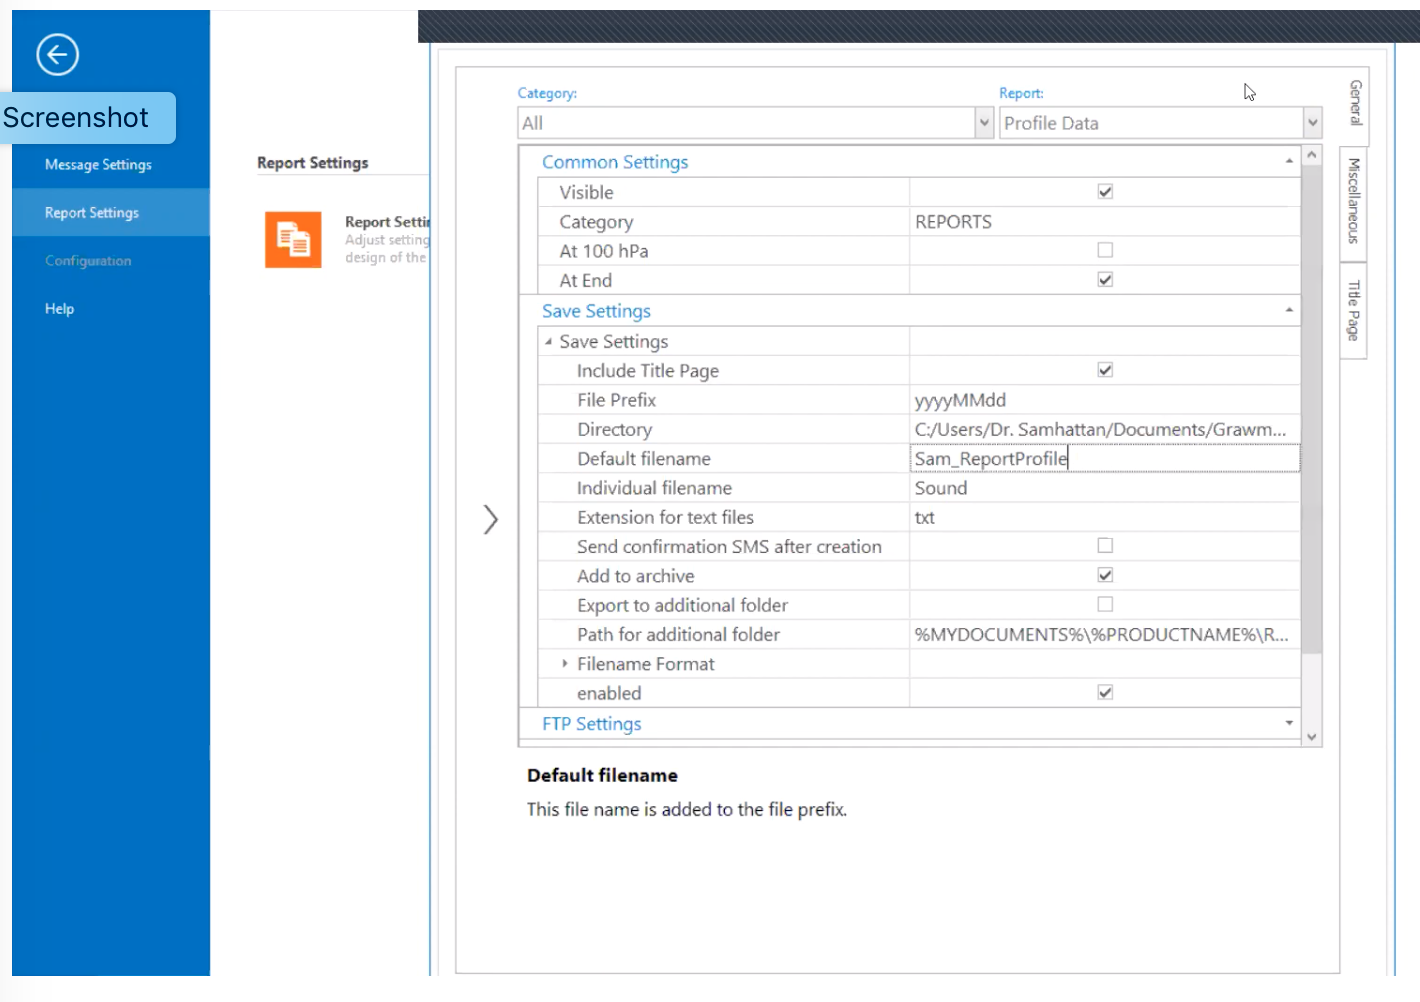
How to save data
Saving data: Grawmet and Lufft: [YouTube video, 26 minutes]
This video offers step-by-step instructions for how to analyze and visualize radiosonde and surface data -- which report types to save; naming conventions; file formats; etc.
Analyzing data
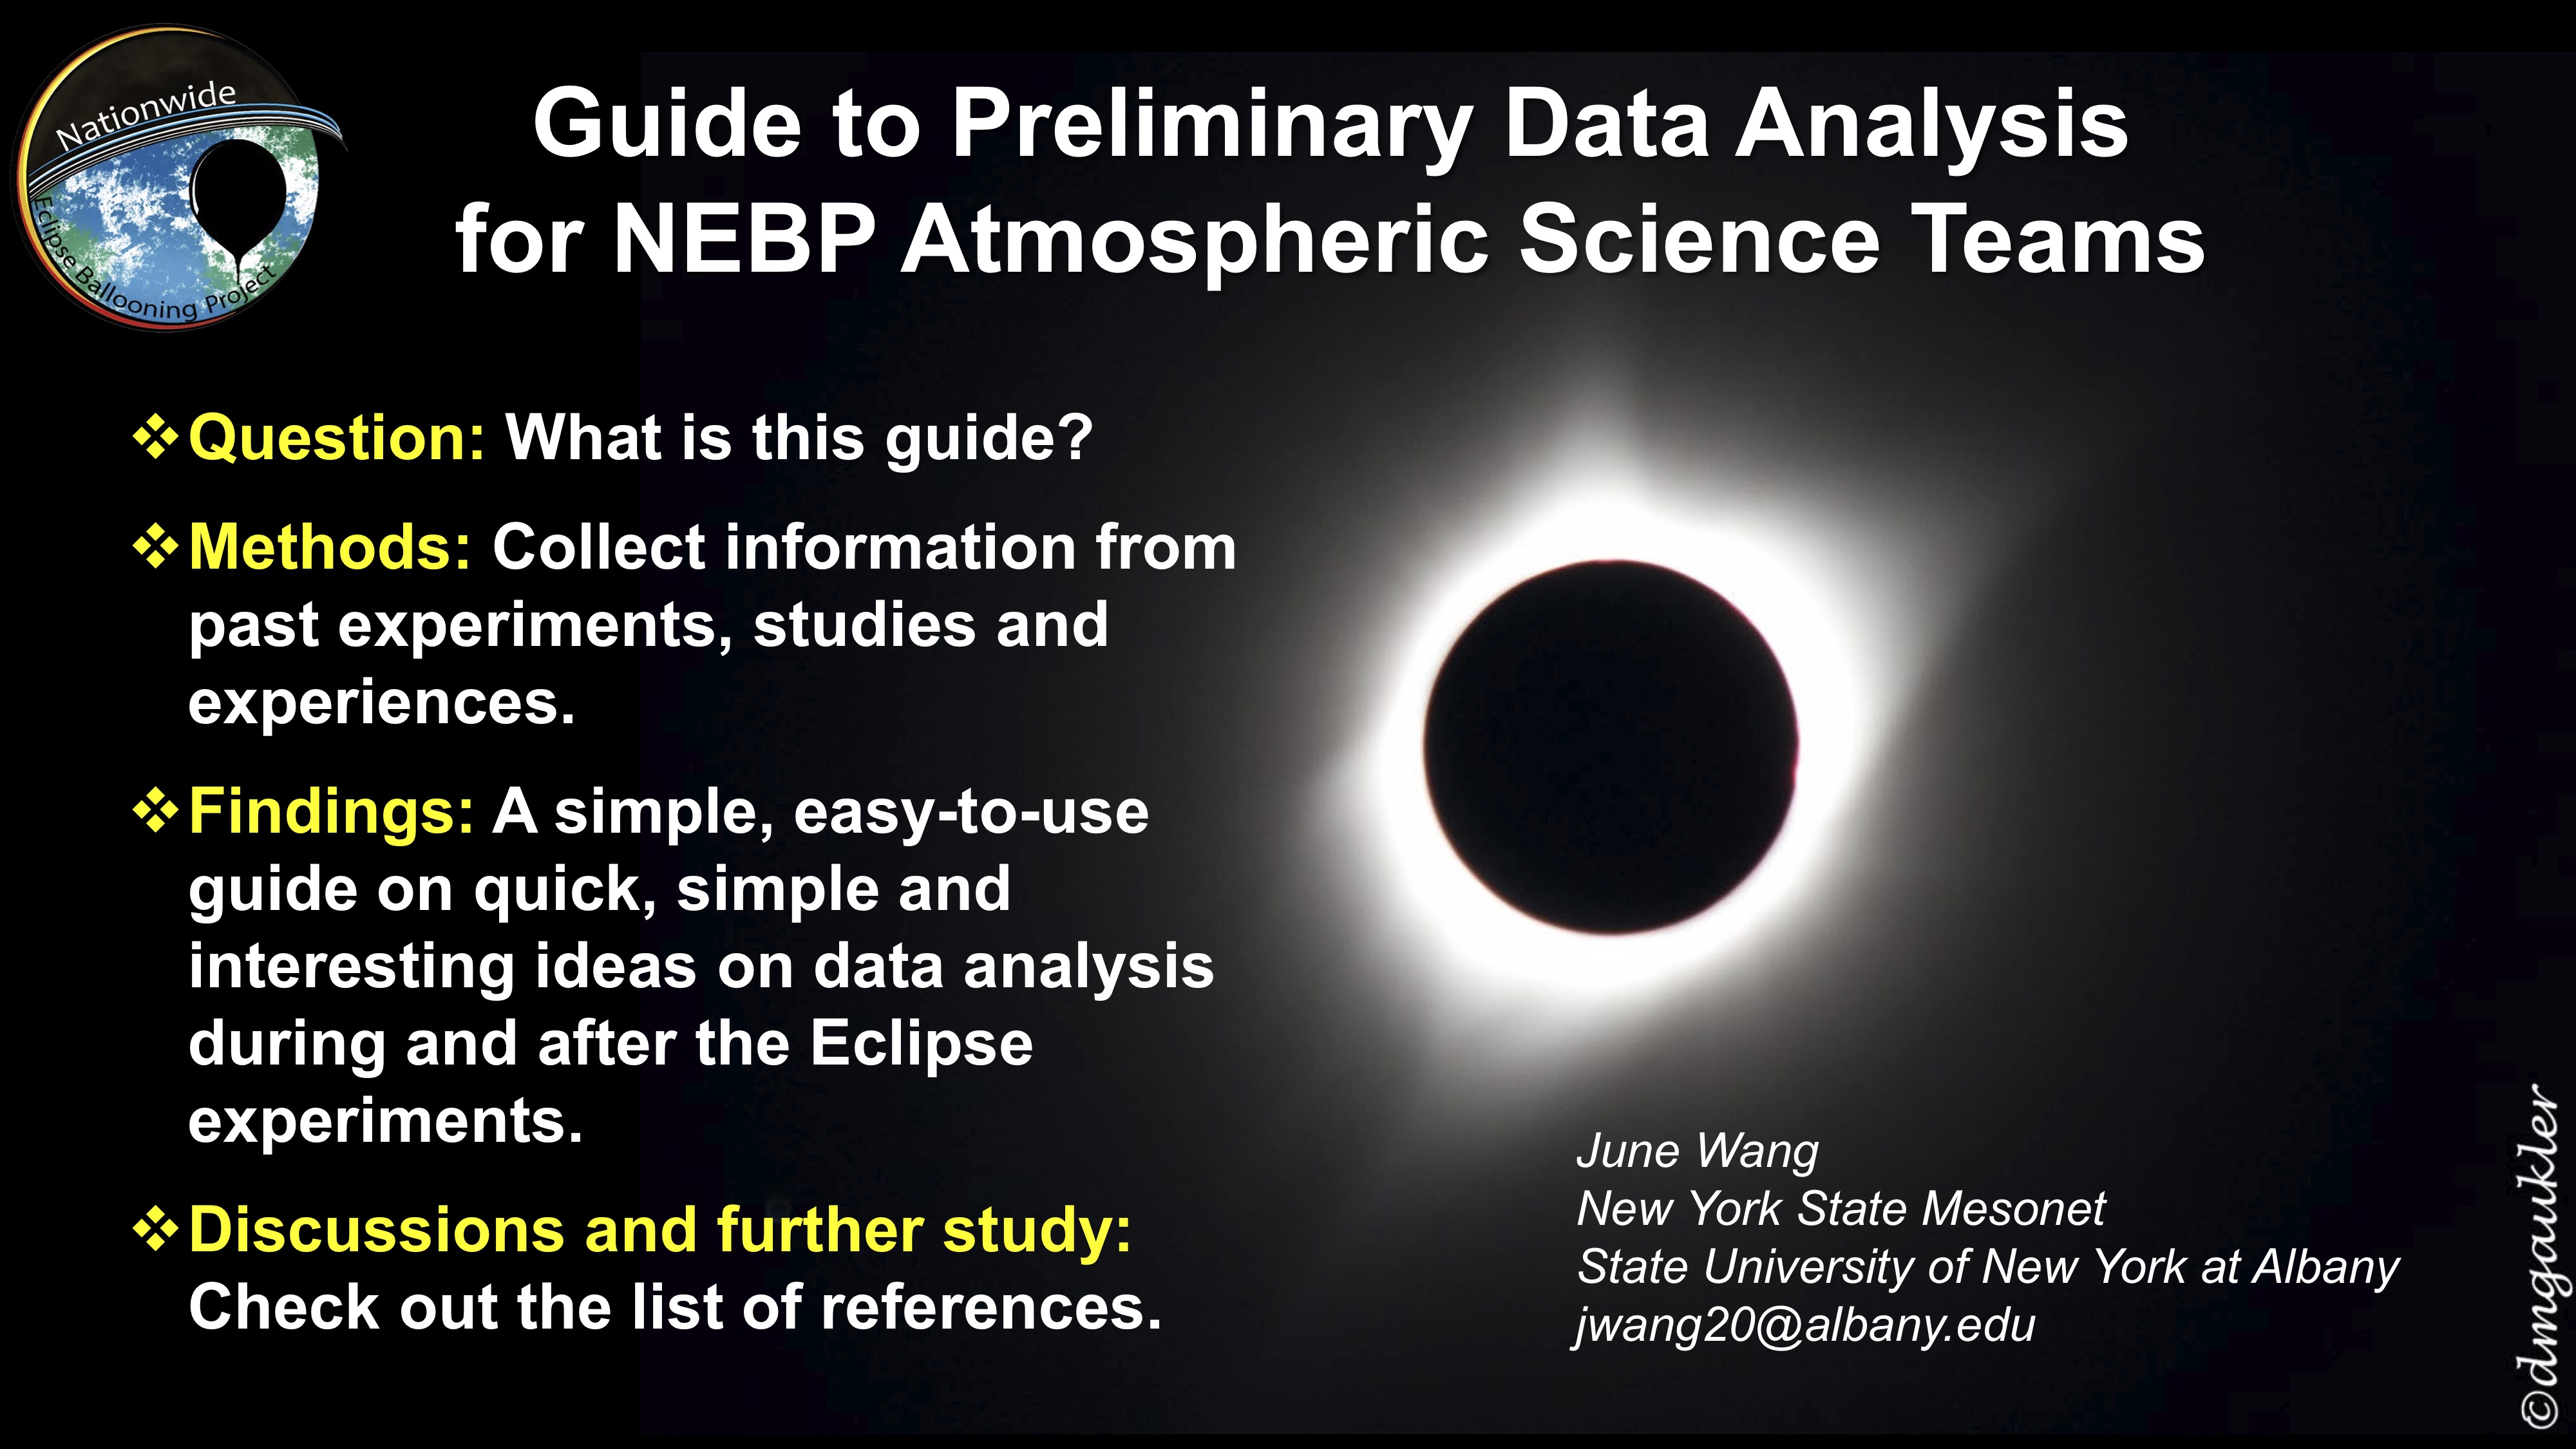
Preliminary Data Analysis for NEBP Atmospheric Science Teams - by Dr. Junhong (June) Wang, Ph.D., University at Albany, SUNY and New York State Mesonet
- This 8-slide presentation offers questions, methods, findings and discussions regarding data analysis for atmospheric science teams of the Nationwide Eclipse Ballooning Project
How to Quality Control NEBP data
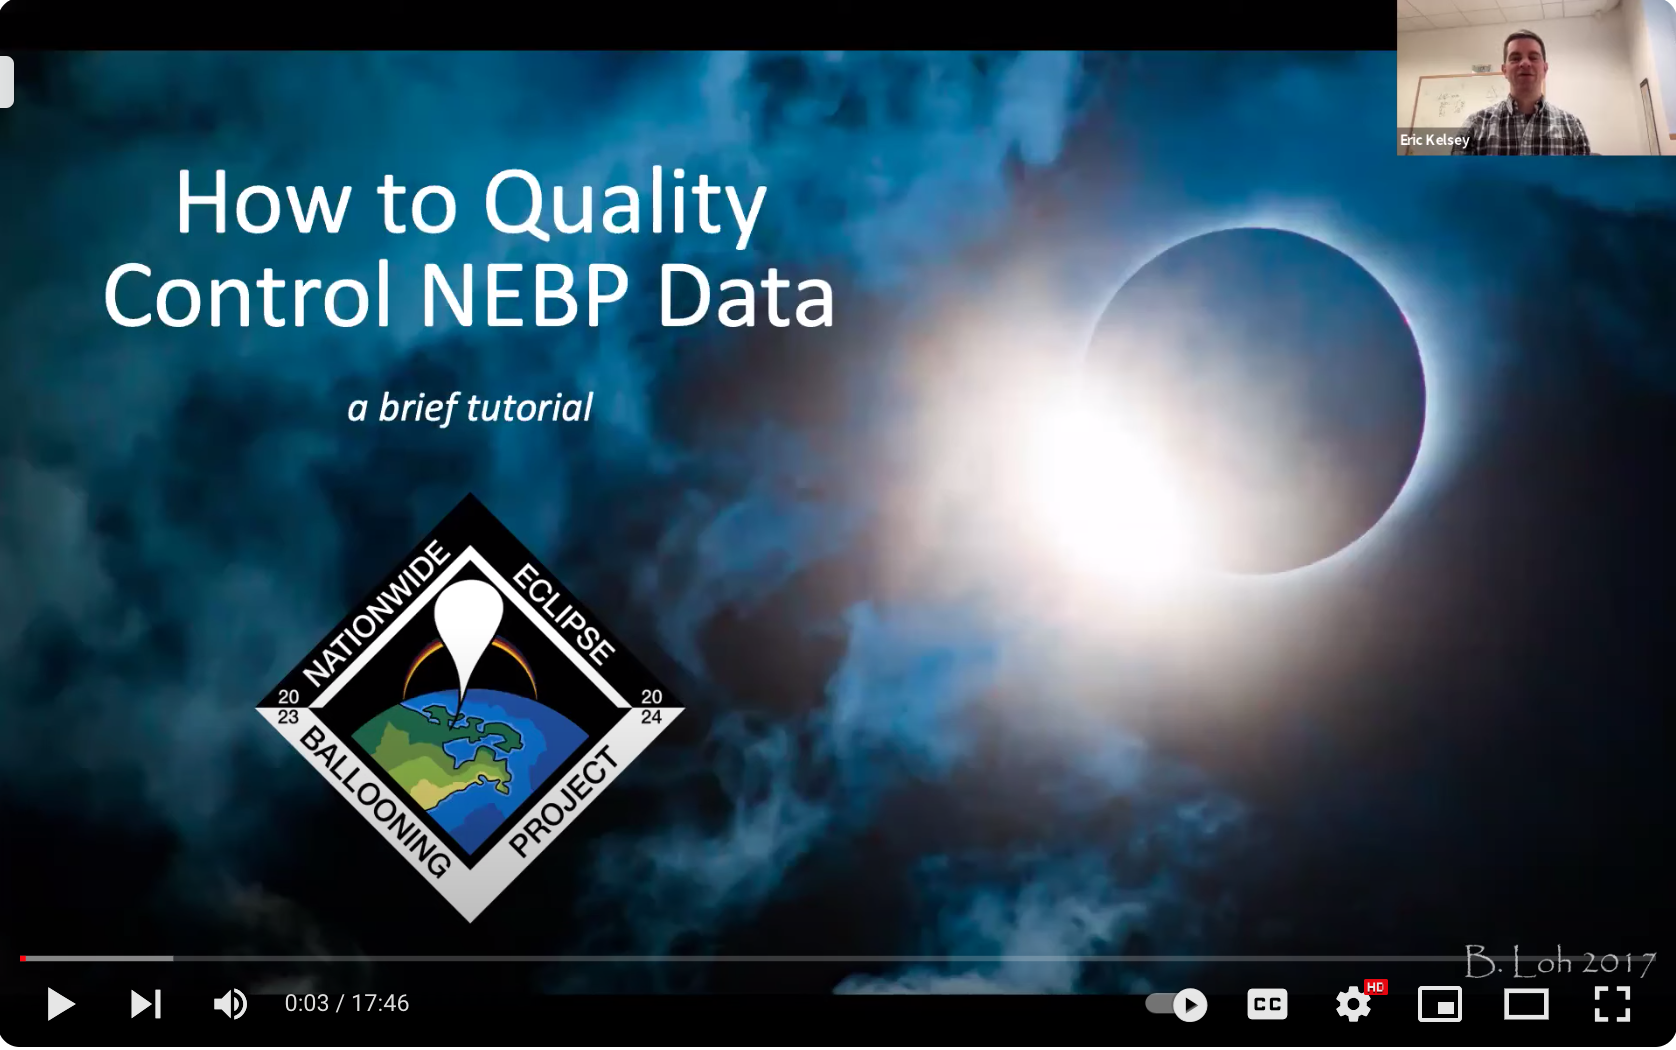
Atmospheric Science teams can review this tutorial to learn what to look for when analyzing and quality controlling your radiosonde data after each flight. Created by Atmospheric Science Pod Lead, Dr. Eric Kelsey. [YouTube video - 17:47]
Analyzing the Planetary Boundary Layer data
NEW January 2024: Tips and Tricks for analyzing the Planetary Boundary Layer Data

Konstantine Geranios of the University of Idaho shares detailed information and screenshots for analyzing the PBL data, including naming conventions and protocols for working with the files. [YouTube video 10:33]
![]() Don't forget to track today's progress in your portfolio
Don't forget to track today's progress in your portfolio
Will you take a few minutes to give us some feedback on this lesson? Thank you!
Course home page // Next lesson >>